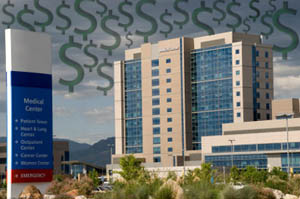
In evaluating a hospital and health plan in the increasingly expensive U.S. health care system, federal officials and researchers often first factor in an assessment of how sick their patients are. A new study, however, challenges the validity of several widely used “risk-adjustment” efforts and suggests that Medicare is overpaying some plans and facilities while underpaying others.
 Without these risk adjustments to level the comparisons, a hospital with more frail and very ill patients—who are more likely to die — might incorrectly appear to be doing a worse job than a hospital with healthier patients — who are more likely to survive.
Medicare risk-adjusts when determining how much to pay private Medicare Advantage insurance plans. It also used risk adjustments when deciding that 2,217 hospitals should be penalized for having high rates of patient readmissions. Risk adjustment is also a key component in new models of delivering care, such as the accountable care organizations.
The new study by the Dartmouth Atlas Project, published today in the health journal BMJ, faults the practice of trying to assess how sick patients are by looking at records to see patient diagnoses. The authors argue that the more times patients see doctors or get tests, the more new diagnoses they are given. “The more one looks, the more one finds,” the authors wrote. The Atlas researchers have asserted in three decades of research that areas of the country with gluts of hospital beds, specialists and other proviers tend to deliver more care, whether it’s needed or not.
“You would think sicker places would have higher visit rates, but they don’t,” said Dr. John Wennberg, the lead author and the founder of the Atlas.
Here’s how their latest study worked: The researchers examined Medicare records for more than 5 million beneficiaries in 306 different regions of the country. They looked at three different formulas commonly used to assess how sick patients are, each based on the number and nature of diagnoses for patients as well their age, race and sex. Medicare uses one of those methods, known as “hierarchical condition categories” (HCC) to adjust for risk.
The researchers also analyzed the death rates of patient populations in each of the 306 regions. They found that the sickness of the patients explained between 10 and 12 percent of the discrepancy between places with high mortality rates and those with low mortality rates. But there was still a wide spread between regions of the country. For instance, under the HCC method, the death rate in the Salt Lake City region was 59.3 patients per 1,000—much higher than around Miami, where the death rate was 32.6 patients per 1,000. If that difference were accurate, then it would appear that patients in Salt Lake City were getting astoundingly worse care than in Miami—something that the researchers considered implausible.
Next, the researchers looked at the number of physician visits the patients had in the previous year. They then used statistical methods to “correct” the sickness rates, essentially reclassifying those patients with lots of excess physician visits as less sick than they would appear based by their diagnoses alone.
When the researchers used this revised metric to look at regional death rates, they now found it explained between 21 percent and 24 percent of the differences between high-mortality and low-mortality areas—twice as much as the standard risk-adjustment methods explained. Once visits were factored into the equation, Salt Lake City’s death rate dropped to 51.8 patients per 1,000 and Miami’s rate rose to 47.3 percent. That was much closer than before, although there remained an unexplained variation.
In a phone interview, Wennberg said the paper showed that the government and others need to refine the methods of adjusting for risk. “The way we’re doing it now has a lot of problems,” he said.